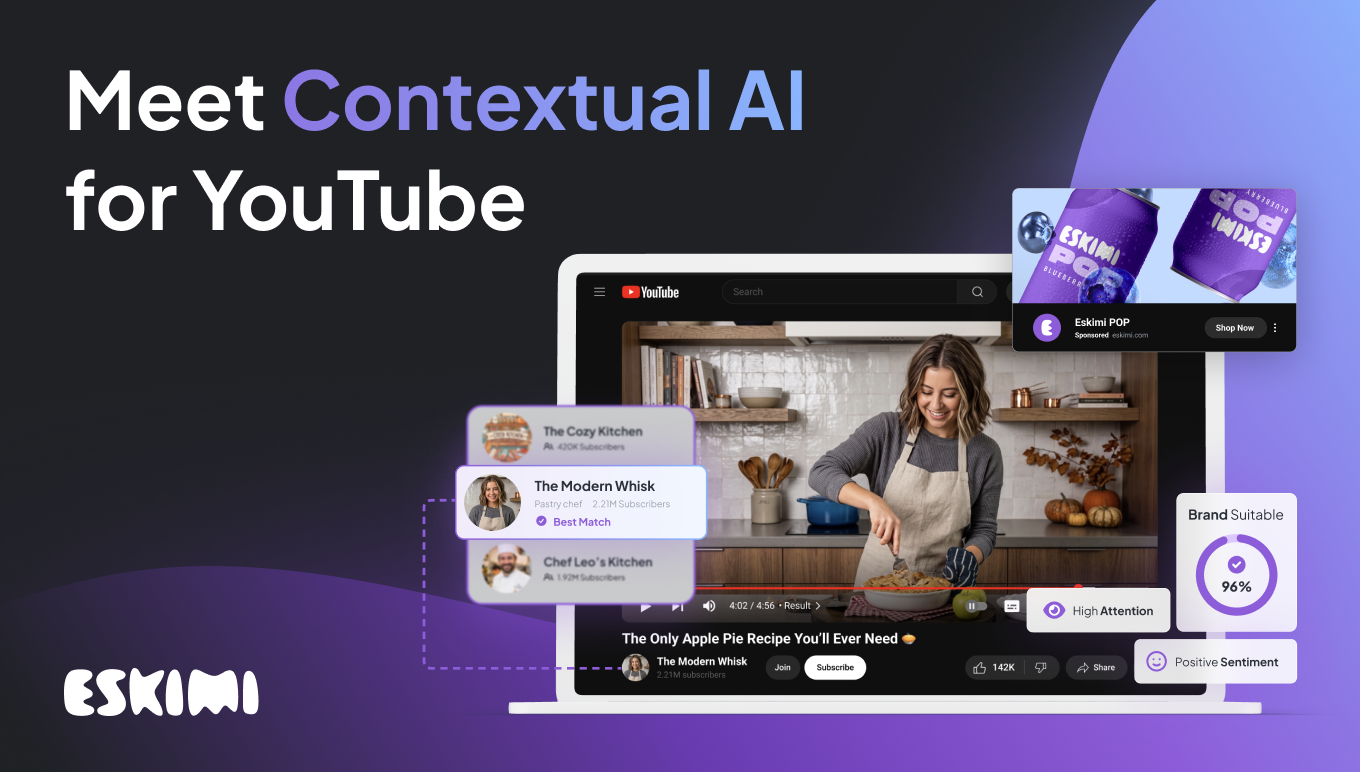
AI Predicts Creative Performance

For years, ad performance was something you discovered after launch. Creative went live, data came in, and only then did optimisation begin.
That model is breaking.
Today, AI can predict performance before a campaign runs by analysing how a creative is built. Not who it targets. Not where it runs. But from the creative itself.
From Subjective Opinions to Predictive Signals
Creative has historically been evaluated through intuition, taste, and experience. While valuable, these inputs were hard to scale and impossible to quantify consistently.
AI changes this by breaking creatives down into measurable attributes such as:
- Visual contrast and saliency
- Focal point clarity
- Text density and hierarchy
- Branding presence and timing
- Emotional cues and visual tension
The result is a shift from opinion-based creative feedback to probability-based performance prediction.
Eskimi Creative Attributes & Insights
Great campaigns start with great creatives. But for advertisers, it hasn’t always been easy to know what makes one ad perform better than another, especially before the campaign goes live.
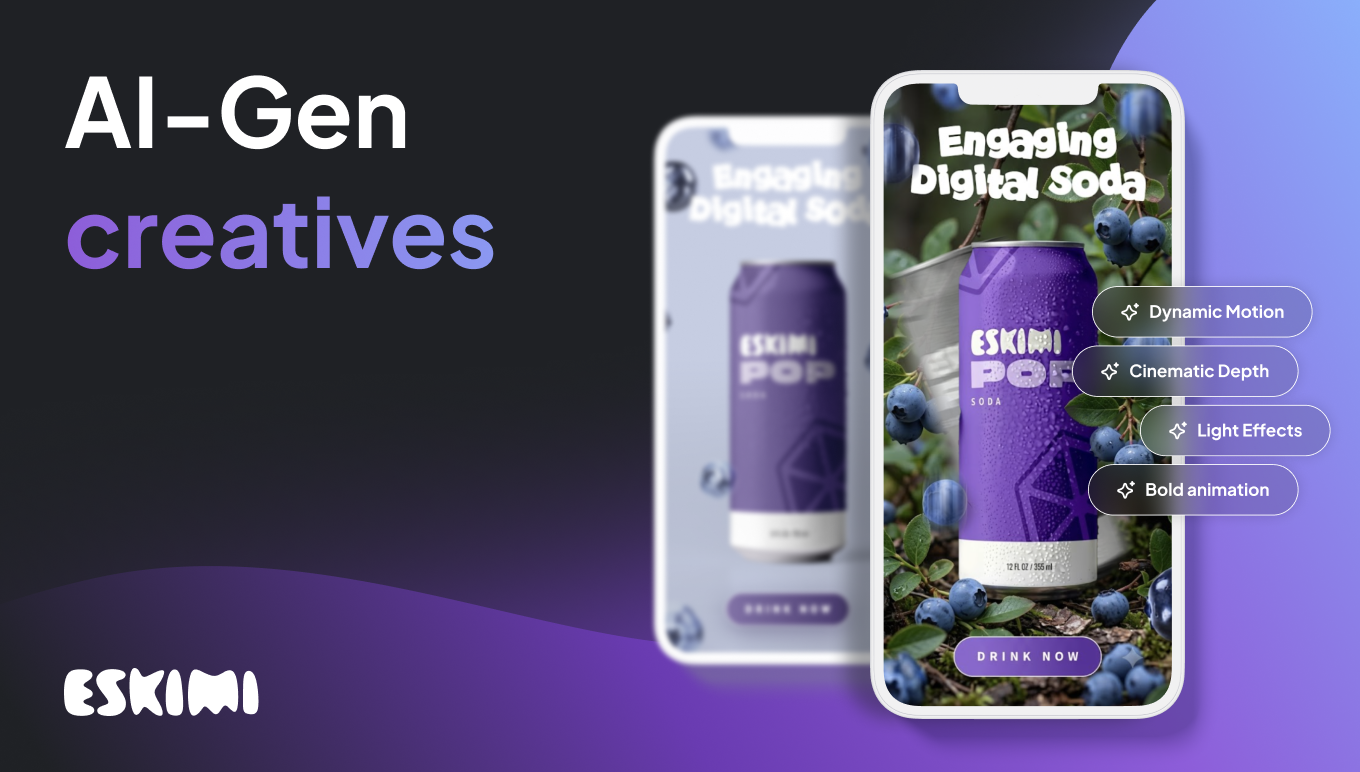
That’s why Eskimi is changing the game with our Creative Attributes & Insights. This new AI-powered feature automatically analyzes every ad you upload, breaking it down into elements like logos, colors, visuals, and text to uncover what really drives performance.
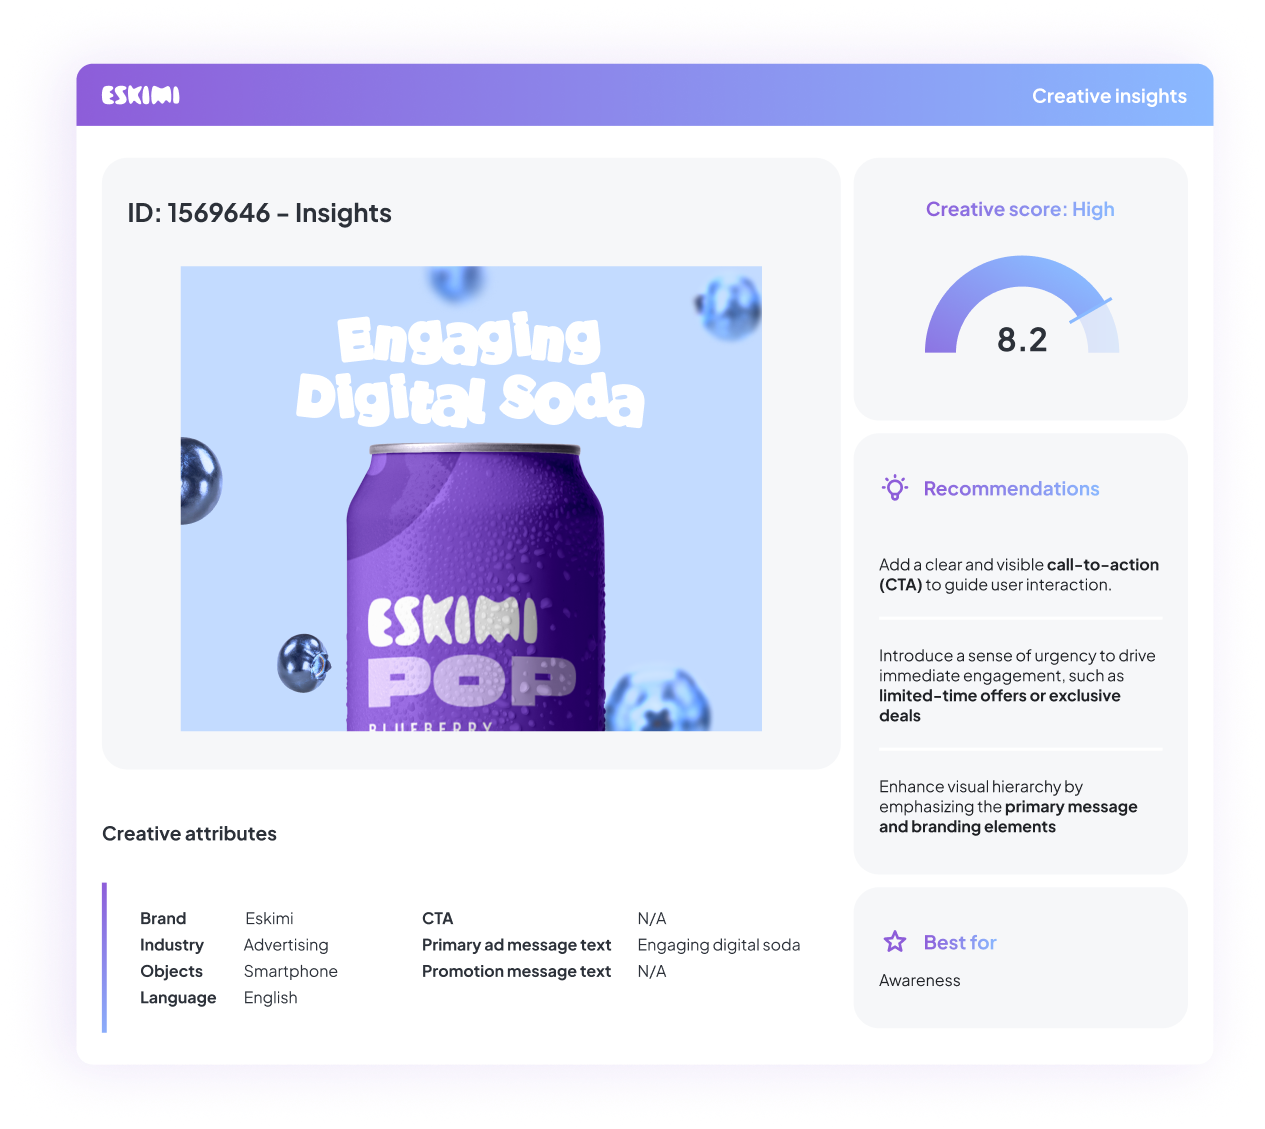
How our creative validation works
When you upload a creative, our AI breaks it down into core elements:
1. Logos
2. Colors
3. Text
4. Visuals
5. And much more
From this analysis, the AI generates a detailed report that helps you understand what's working, what needs improvement, and how to optimize.
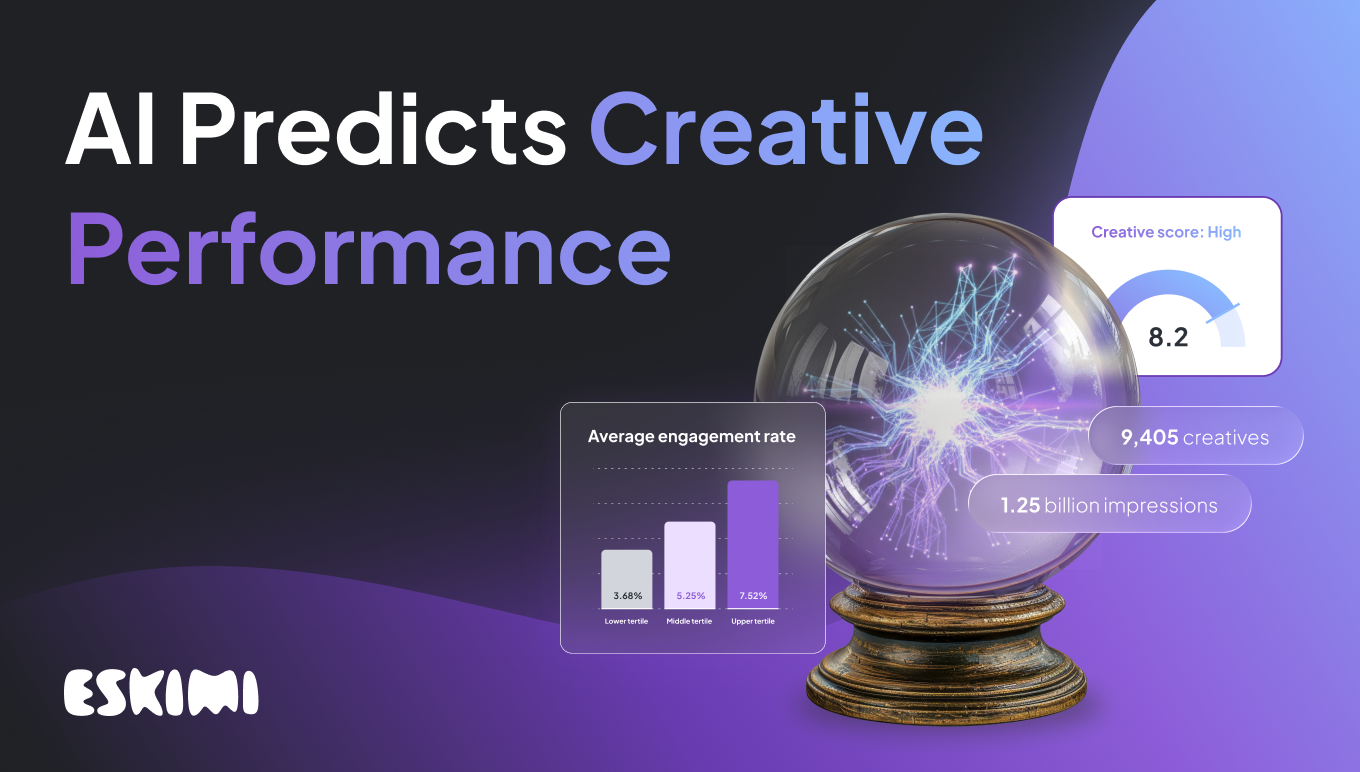
Creative Score
Every creative receives an overall score that measures its effectiveness against industry benchmarks, so you know exactly where you stand.
It calculates it based on visual clarity, branding strength, message effectiveness, call-to-action, and urgency & engagement in the creative.
So how does this “prediction” correlate with real-world results?
We set out to find out!
What the Data Shows: Creative Quality Predicts Engagement
Using Eskimi’s Creative Attributes & Insights scoring model, Creatives were grouped into three score brackets and evaluated against real delivery data on engagement rate.
The dataset includes over 1.25 billion impressions across 9,405 creatives. At this scale, random fluctuation becomes statistically negligible.
Confidence Level:
With sample sizes in the hundreds of millions of impressions per group, the results exceed a 99.9% confidence level. High volume creatives influence results proportionally
- Performance reflects real delivery conditions
- Outliers with low impression counts do not distort outcomes
- This approach mirrors how performance is evaluated in live buying environments.
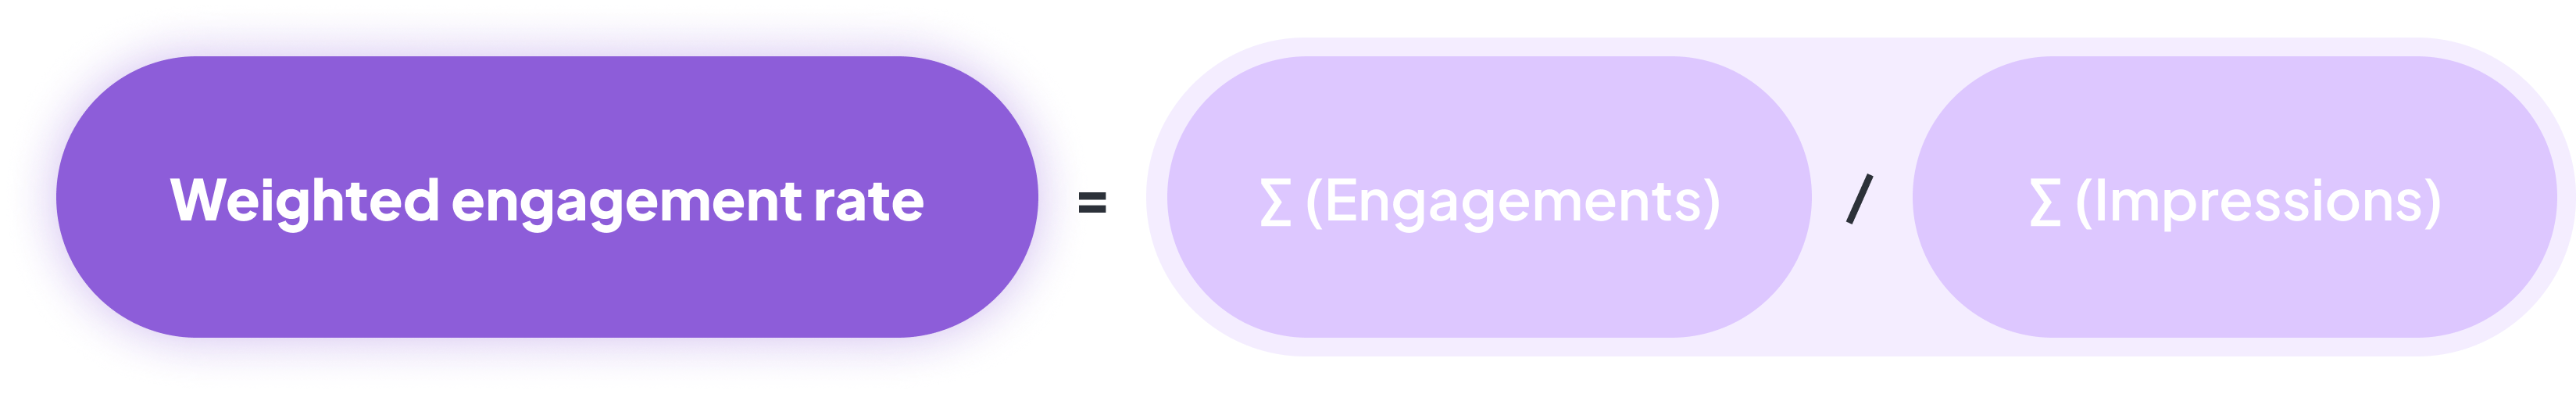
To avoid bias from small, high performing creatives, engagement was calculated using impression weighted averages.
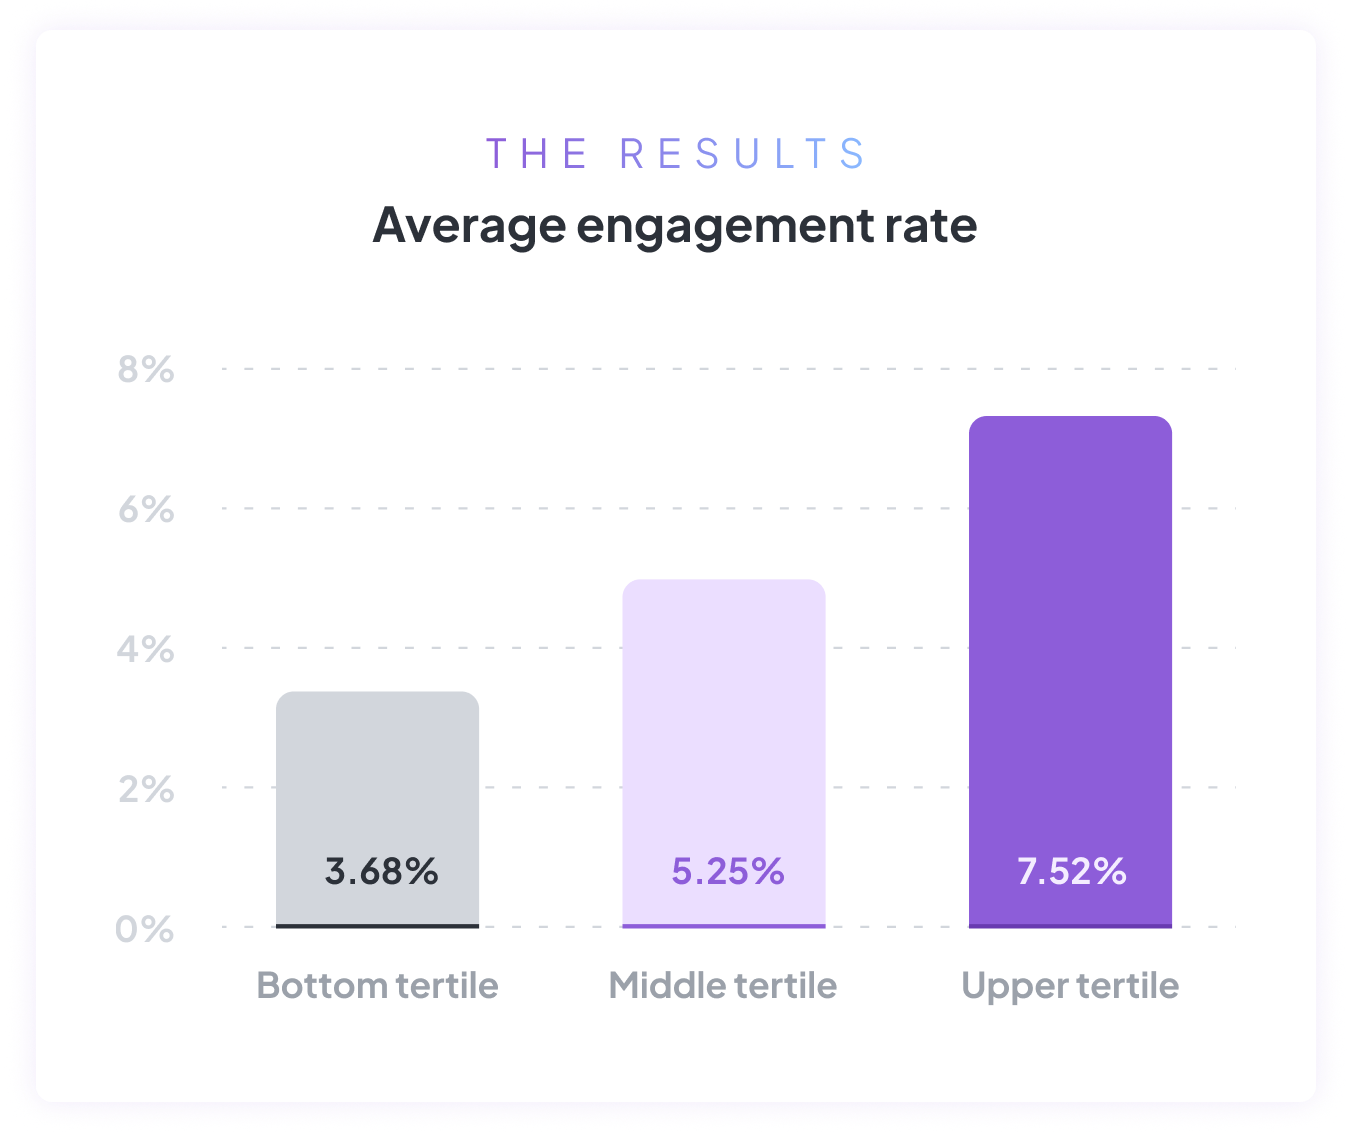
The Results
And now, it is predictable.
Score 1-3: Average Engagement 3.68%
Score 4-6: Average Engagement: 5.25%
Score 7-9: Average Engagement 7.52%
Why This Matters: Creative Is Now a Predictive Lever
Most optimisation today still happens downstream:
- Adjust bids
- Change targeting
- Rotate formats
- Pause underperformers
Creative analysis flips this logic upstream.
If AI can predict which creatives are statistically more likely to perform, teams can:
- Reduce wasted production
- Test fewer but better ideas
- Launch with higher baseline performance
- Shorten learning cycles dramatically
Instead of asking “Which creative won?” after launch, teams can ask
“Which creative is most likely to win?” before launch.
Creative Becomes a Scalable Performance Variable
The industry has already accepted algorithmic optimisation in bidding and targeting. Creative has lagged behind because it was difficult to measure.
That gap is closing.
AI models now understand how humans visually process ads. They can estimate attention, predict engagement, and highlight structural weaknesses long before media spend is committed.
Eskimi’s creative attributes model shows that when creative fundamentals are strong, performance follows consistently.
Different models. Same outcome.
The Competitive Advantage Is Moving Upstream
The next competitive edge in advertising will not come from buying media better. That advantage is shrinking as platforms automate.
It will come from designing better creative earlier.
Teams that integrate AI driven creative analysis into their workflow will:
- Launch stronger campaigns
- Waste less budget
- Learn faster
- Scale winners with confidence
Creative is no longer just art or instinct. It is data, probability, and performance.
Level Up Your Advertising with Eskimi
- Reach 96% of Open Web
- 2,500+ Targeting Options
- 100% Managed or Self-Service
- In-House Creative Studio Team
- Display, Video, In-Game & CTV
- #1 Rated DSP on G2