Programmatic Advertiser’s Guide To GA4

Challenges are a part of every digital marketer’s daily life. Interestingly, Google is often the one that just throws them at us or is at least partly responsible for the ongoing changes in the industry.
This time, everyone using Universal Analytics is preparing for an inevitable switch to Google Analytics 4 – some are more excited about this than others.
The thing is – you have no choice but to embrace this change and start migrating from UA to GA4 as soon as you can.
But in the meantime, we’d like to guide you through the key things you need to know about the transition to GA4 and some specifics that can help programmatic advertisers get the most out of this data analytics tool.
Let’s dive in and learn:
- What is GA4?
- When should you switch to GA4?
- Pros & cons
- What are the key differences between UA and GA4
- How to navigate GA4 reports
- How to set up and confirm you get data in GA4
What is GA4?
Google Analytics 4, or GA4, is a platform that provides you with all the necessary tools to better understand your audience and its activities, i.e., enables you to measure traffic and engagement across your websites and apps.

By collecting, analyzing, and organizing a trail of information every internet user leaves behind them, GA4 can provide valuable insights into any business.
Compared to Universal Analytics (UA), GA4 isn’t just a significant update to the previous version. It is a new kind of property with different reports than those you’re used to, so the goal is to switch from UA to GA4 as smoothly as possible.
Should you switch to GA4 now?
The short answer: yes, as soon as possible.
In 2020, Google introduced “new, more intelligent Google Analytics” that is going to replace Universal Analytics, which most of us have been using up until now, on October 1st, 2023. Two years later, the technology giant pushed the switching date to July 1st, 2024, giving businesses more time to make the transition.
Does it mean that you can now chill and simply switch when the time comes?
Not really, since Google is still planning that all standard Universal Analytics properties will stop processing new hits on July 1st, 2023, and 360 Universal Analytics properties will follow on July 1st, 2024.
Migrating as early as possible ensures that you will have more historical data in GA4. Besides, giving yourself time to adapt will make the process much easier than having to rush over it when you no longer have a choice.
Pros and cons of switching to GA4
Sooner or later you will have to switch to Google Analytics 4, so it’s essential to have a better understanding of what awaits you once you migrate.
At its best, GA4 enables you to get a complete view of consumer behavior across the web and apps by using first-party, modeled data.
It has improved machine learning features, offers actionable reporting, and new integrations that can help you keep up with the changing privacy and technology landscape, while still getting the insights that you need.

As for some more significant cons, GA4 will definitely require more technical skills and knowledge. Although it has become a great tool for analysis, for someone without a technical background, it can quickly become fairly challenging to use.
Besides, the platform is constantly changing, and both existing and new features are under development, which means that users have to put their time and effort into keeping up with all the updates.
GA4 vs. Universal Analytics: what’s the difference?
GA4 is so different that it’s not completely wrong to say that the only similarity between Universal Analytics and Google Analytics is the name.
As for the rest, it’s a whole new environment that comes with a new interface, a new tag template in GTM, new data models, new steps to configure, and many more.
Let’s go through a couple of the most significant changes.
A new approach to data
One of the biggest differences between UA and GA4 is how it changes your approach to data. It’s a substantial shift, not just a refinement or an enhancement like we’ve seen with prior updates.
Put simply, while UA is a session-based analytics tool, in GA4, data is centered around events.
Until now, UA used session and cookie-based methodology, so this new model is fundamentally different from what we’re used to. It will especially affect paid search marketers, who will need to rethink their KPIs and how to optimize their efforts more meaningfully in the future.
For instance, switching from “How do I decrease bounce rate?” to “How do I increase engagement?” might sound like a minimal change, but this is how we will need to frame the data we view in GA.

Changes in metrics
Another important difference lies in data measurement since the majority of metrics got at least a slight makeover.
For example, users – one of the key metrics that programmatic advertisers track.
In UA, there are two user metrics (Total and New Users), while in GA4, you can find Total Users, Active Users, and New Users.

Another significant difference is how UA and GA4 “see” such metrics as Bounce rate or Engagement rate.
In GA4, Bounce rate is the percentage of sessions that were not engaged sessions. In other words, Bounce rate is the inverse of Engagement rate.
In Universal Analytics, Bounce rate is the percentage of all sessions on your site in which users viewed only one page and triggered only one request to the Analytics server.
Bounce rate, as it's calculated in Universal Analytics, is a reasonable measure of site engagement, but it has become less useful as websites and apps have changed.
For example, it's possible for users to view a single-page application (SPA) and leave without triggering an event, which would be considered a bounce.
Additionally, Bounce rate, as it's calculated in Google Analytics 4, provides a more useful way of measuring the level at which customers engage with the property.

Enhanced measurement
As opposed to Universal Analytics, Google Analytics 4 offers some interactions that are tracked without the need to change the website’s code or configure a GTM container. This auto-tracking feature is called Enhanced Measurement, and it’s a part of event tracking in GA4.
Enhanced Measurement is a suite of automatic event-tracking features that allows marketers/analysts to collect more data out of the box. In the UA, only pageviews existed.
Speaking of automatic events (but excluding enhanced measurement), there are some additional events that GA4 tracks automatically as well:
- first_visit. This is the first time a user visits a website or launches an app.
- session_start. When a user engages the app or website and starts a new session.
- user_engagement. This event is fired 10 seconds after the visitor has stayed on a page.
You can disable/enable events individually by clicking the gear icon in the Enhanced Measurement section.
Navigating reports in GA4

To create reports, GA collects various data from websites and apps. As a user, you can use these reports to monitor your website traffic, investigate data, understand your audience and its behavior. Note that this data is added with a slight delay.
Once you set up Google Analytics and it starts collecting data (some of it is collected from your websites and apps, and other data might require additional setup), it appears in the Realtime report section, and shortly after that, other reports also become available.
GA4's dashboard is actually full of ready to use reports. The main one and the most important for programmatic advertisers is the Traffic acquisition report. We'll cover it in no time, but let's get familiar with other available options as well.
To find all your reports, log in to your GA4 account and select Reports on the left.

1. Reports snapshot

As the name suggests, Reports snapshot is a place where you can get a quick look at important metrics.
Officially, it is simply an overview report that is available in the Report section. It summarizes all the reports within your GA.
You can set any report as the Reports snapshot. It can give you an idea of your overall website/app performance, but you can always go and dig deeper into the available data.
2. Realtime

Realtime lets you monitor the activity on your website or app in real-time. The dashboard design with different data cards allows you to see how users enter the conversion funnel and how they behave once they’re in it.
For instance, in the Realtime report, you can see:
- The number of users during the last 30 minutes (per minute)
- Where users are coming from (source, medium, or campaign)
- Who your users are
- How they engage with your content
- Which events they trigger
- How they convert
3. Traffic acquisition

The key report for advertisers running programmatic campaigns.
If you want to know through which channels your visitors use to come to your sites (and you likely do), what campaigns drive them in, or find out if any certain channels perform better than others, the Traffic acquisition report is what can benefit you here.
This helps you understand what led new and returning customers to your website and, likely, can help make decisions in the future.
To access Traffic acquisition report, go to Life cycle > Acquisition on the left side of the dashboard, and choose Traffic acquisition.
To check the performance of your programmatic ads, you will need to sort data based on the source/medium, e.g., if you're running campaigns with Eskimi and UTMs have been set, you have to choose it accordingly to see the results.
You can also easily edit and adjust this report to your needs.
4. User acquisition
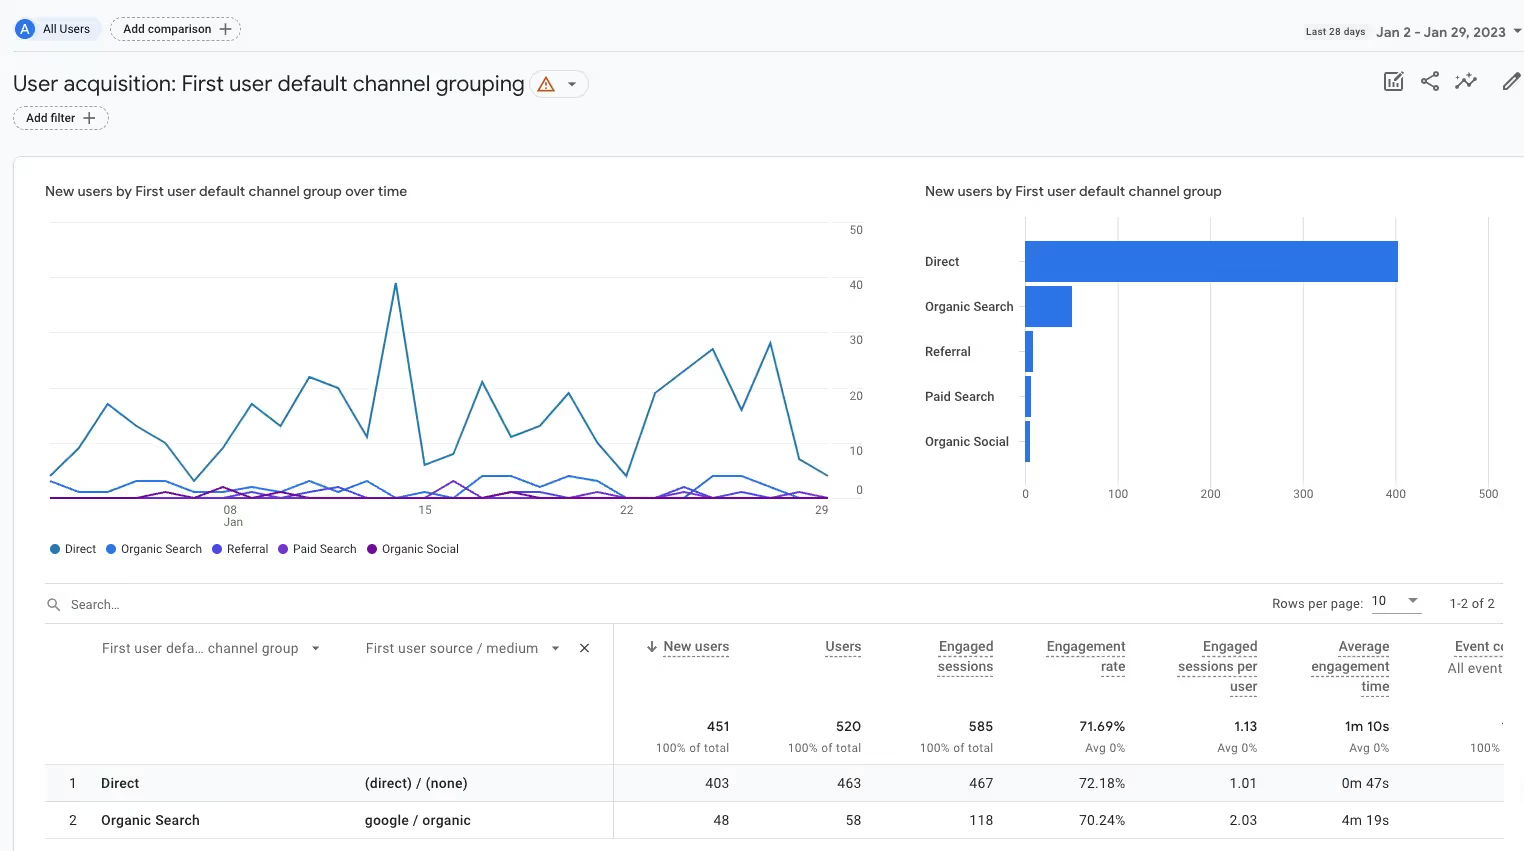
How is this one different from the Traffic acquisition report, you ask?
Both these reports show different acquisition data.
While the Traffic acquisition report helps you understand what was the reason that new and returning customers visited your website again, the User acquisition report shows how people who have never used the property discovered it.
5. Acquisition overview

Acquisition overview provides a clearer view of how all traffic and users were acquired and is fully customizable.
6. Campaigns

Campaigns report is pretty straightforward – it allows you to see the performance of your campaigns. Unexpected, huh?
This is also the part that you can edit and fully customize to best suit your needs.
7. Engagement reports – landing pages

Engagement reports let you examine the effectiveness of the first pages people land (landing pages) on when they visit your website.
8. Demographics overview

Demographics report lets you analyze your audience by age, gender, and interests categories, allowing you to get to know your visitors better.
To access the Demographics overview, select Reporting from the drop-down menu in the top left of the Analytics interface.
Then select Demographics > Overview under User in the left navigation bar.
9. Tech overview

The Tech overview report in Google Analytics displays the property’s traffic by visitor's technology, such as platform, operating system, screen resolution, and app version.
You can see:
- Users by Platform – the percentage of overall users to the property by platform.
For example, web, iOS, or Android. - Users by Operating system – the operating systems used by visitors to the property. Includes mobile operating systems such as Android or iOS.
- Users by Platform/Device category – the platform and device on which the property ran. For example, web/desktop, android/mobile, or iOS/tablet/Smart TV.
For more detailed information about GA4’s reporting, you can visit this link.
How to set up GA4?
Here’s what you need to do to install Google Analytics 4 with Google Tag Manager:
- Create a new GA4 property.
- Create a data stream (a flow of data from a customer touchpoint (e.g., app or website) to GA4).
- Copy the Measurement ID (known as a tracking ID in Universal Analytics).
- Create a Google Analytics 4 Configuration tag.
- Paste the Measurement ID and set the tag to fire on All Pages.
- Preview/test the new tag.
- Publish the changes in Google Tag Manager.
The code can be hardcoded in the website’s code, but Google strongly recommends implementing it through the Google Tag Manager because of the following reasons:
- Fast deployment of tracking codes
- You can control all tags in one place
- Built-in and 3rd party testing tools
- Reusable container templates (recipes)
- Simple (kind of) event tracking
- It’s free
- Built-in tag templates
- Custom templates
- Versions
- Workspaces and environments
- Security
- User permissions
If you followed the steps above and can’t access your data in Google Analytics, check out this article about common issues with the tag setup.
How to confirm you get data in GA4?
Some reports and explorations can take 24-48 hours or even more to process data. There are some accounts where data is aggregated even with 72 hours delay.
To confirm that you’re collecting data from the website or app, you can use Realtime and DebugView reports that you can access by going to the Admin panel > Property > DebugView.
Realtime report was presented above.
DebugView report

Enabling DebugView mode on your devices allows you to start monitoring events as they’re triggered.
This can help you set up data collection, troubleshoot issues as they arise, and better understand users’ behavior as they explore your site.
Realtime vs. DebugView reports
The following table outlines key differences between these two reports:

Conclusion
The time will come, and the transition to GA4 is inevitable – so better start preparing now.
There are two ways you can proceed with this:
- Create a new property
- Migrate your current UA property to GA4
Remember that Google itself has clear documentation on most of the things above and step-by-step instructions to make the transition (here and here). Don’t be afraid to use the resources you have and benefit from the best that GA4 has to offer.
Level Up Your Advertising with Eskimi
- Reach 96% of Open Web
- 2,500+ Targeting Options
- 100% Managed or Self-Service
- In-House Creative Studio Team
- Display, Video, In-Game & CTV
- #1 Rated DSP on G2